Copyright © 2003 Per Kraulis,
Stockholm Bioinformatics Center, SBC
KTH Bioinformatics 2003,
öecture 27 Feb 2003,
Per Kraulis
4. Network properties
Metabolic and signalling networks are complex: There are many
nodes (proteins, particles, molecules) and many connections
(interactions). This is obvious from nearly any illustration
of a network. And even if one can define sub-networks that can be
meaningfully described in relative isolation (such as the citric acid
cycle, or the ras p21 signalling network), there are always
connections from it to other networks.
The overall structure of a network can be described by several
different parameters. For example, one may calculate the
average number of connections a node has in a network, or
the probability that a node has a given number of
connections. Theoretical work has shown that different models
for how a network has been created will give different values for
these parameters.
One can also plot the relative frequency of each node
as a function of the number of connections of the
nodes. Both axes in the plot uses logarithmic scales. Using data from
real networks or from simulations of different types of randomized
networks, one obtains log-log plots that turn out to have
characterisic shapes depending on how the properties of the networks
and how they were generated. Examples are shown in the figures below.
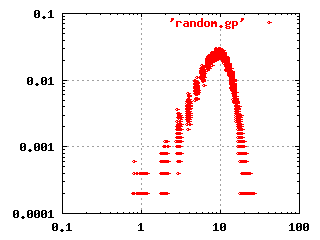
 The classical random network theory by Erdös and
Renyi (1960) states that given a set of nodes, the
connections are made randomly between the nodes. This gives a network
where most nodes have the same number of connections. There are
extremely few, if any, nodes that have many connections. The log-log
frequency plot for this kind of network is shown to the left.
Recent research has shown that this model does not fit the structure
found in several important networks, such as the Internet, World-Wide
Web, power grids, or social networks. Instead, these real-life complex
networks are better described by a so-called scale-free,
hierarchical model where most nodes have only a few
connections, but a few nodes (called hubs) have a very large number of
connections.
Recent work by Jeong, Barabasi et al (Nature (2000) 407,
651-654), indicate that metabolic networks are examples of
such scale-free networks. This result is important, and will
probably lead to new insights into the function of metabolic and
signalling networks, and into the evolutionary history of the
networks.
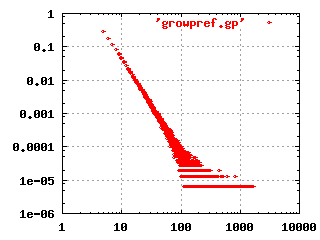
 The image to the left shows the characteristic shape of a
scale-free, hierarchical network in a log-log plot. This
particular plot was produced by simulating a growing network, where
each new node is connected randomly to existing nodes, but with a
higher preference for already highly connected nodes. A plausible
mechanism that could give this result in biological evolution would be
gene duplication and divergence. An organism has a higher chance of
creating new, useful functions by making copies of already existing
systems and modifying these, rather than create new functions from
scratch. It is possible that certain classes of genes are easier to
cut-and-paste than others, and this may result in scale-free networks.
Robustness is another important property of metabolic
and signalling networks. This is the ability of the network to produce
essentially the same behaviour even when the various parameters
controlling its components vary within considerable ranges. For
instance, recent work (von Dassow et al, Nature (2000) 406,
188-192) indicates the segment polarity network in the
Drosophila embryo can function satisfactorily with a
surprisingly large number of randomly chosen parameter sets. The
parameters do not have to be carefully tuned or optimized. This makes
biological sense: A signalling system should be tolerant with respect
to mutations or large environmental changes.
 The classical random network theory by Erdös and
Renyi (1960) states that given a set of nodes, the
connections are made randomly between the nodes. This gives a network
where most nodes have the same number of connections. There are
extremely few, if any, nodes that have many connections. The log-log
frequency plot for this kind of network is shown to the left.
 The image to the left shows the characteristic shape of a
scale-free, hierarchical network in a log-log plot. This
particular plot was produced by simulating a growing network, where
each new node is connected randomly to existing nodes, but with a
higher preference for already highly connected nodes. A plausible
mechanism that could give this result in biological evolution would be
gene duplication and divergence. An organism has a higher chance of
creating new, useful functions by making copies of already existing
systems and modifying these, rather than create new functions from
scratch. It is possible that certain classes of genes are easier to
cut-and-paste than others, and this may result in scale-free networks.