Why queues are inevitable
2015-01-31
We love to complain about queues. Why do we have to wait? Do not the queues in e.g. the health care system show that too few resources are allocated to it? I have looked a little closer at this problem.
My conclusion: No, we are probably not willing to pay what it costs to eliminate queues. My results rely on some basic assumptions, and are applicable to many different types of scenarios. I have used computer simulations to investigate the problem. The numbers speak for themselves: The queueless society is an unreasonable utopia.
I work in a service facility (the National Genomics Infrastructure in Sweden within SciLifeLab), where we process samples submitted by researchers in Sweden and deliver data (DNA sequences) back to them. The most common complaint to us is that our queues are too long. It is whispered that the Karolinska Institute , where many of our users are based, is thinking of opening a separate service, to which, as a KI representative told me, "the researchers can go and get their samples run directly without any queue." I started thinking about it. Is this a reasonable goal?
There is a very well-developed theory about this, mainly in the field of Discrete Event Simulation, but the basic features are so simple that I programmed what follows myself. Source code and other files are available in my GitHub repo queue_simulation for those who want to look at the details.
An absolutely fundamental assumption I make is that tasks arrive at the service facility completely independently of each other. There is no appointment scheduling, planning or herd behavior. A patient gets sick quite independent of others, and a researcher submits a sample to NGI completely independent of other researchers. If this is the case, one can use a so-called random number generator, a kind of computer-based dice, to write a computer program to simulate the process.
So what happens if we simulate a service facility to which tasks are submitted? Here is a visual representation:
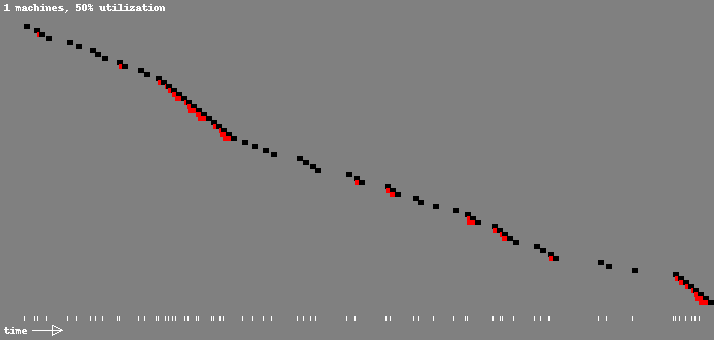 Simulation of task execution and queue. 50% utilization of resources.
This figure shows time horizontally. Each task is displayed in its own row. The following colors are used:
- Black shows the time it takes to perform the task. I have chosen to assign that time the same value for all tasks, for simplicity.
- Red indicates the time that the task must wait before it can start to be performed. This occurs when there are other tasks that arrived before this one, and therefore will be dealt with on a first-come, first-serve basis.
- White markings in the bottom row, which show at what time each task was submitted to the facility. Note the uneven spread! That is what happens if the tasks are received purely random. It is this unevenness that is the root cause of the results I will describe. This effect, which depends on chance, is no coincidence, ironically. That is how reality works: randomly placed dots gives an uneven distribution.
In this simulation, I have chosen a level in the influx of tasks so that approximately 50% of the total capacity of the service facility is used. The facility is therefore idle half of the time. Already at this stage one can see something very interesting: There are a number of occasions when the incoming tasks are forced to wait in line. Specifically, 35 of the 70 tasks in this figure must wait their turn while the rest can begin to be processed immediately when they arrive.
So this means that even if we have twice as much capacity as is required, strictly speaking, about half of the tasks will still have to wait in line!
If we are economists and administrators, or the one who actually pays for the party, we may want a more efficient operation, so that the facility works at, say, 90% of its capacity, and stands idle only 10% of the time. That may seem reasonable? The following happens:
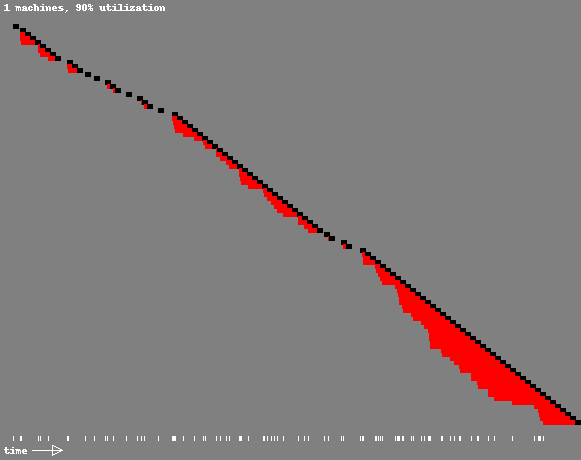 Simulation of task execution and queue. 90% utilization of resources.
Oops! A lot of red, which means a long wait for many tasks.
- The vast majority of tasks end up in a queue. In this case, 87 of a 100.
- Those who end up in a queue languish there for a long time: on average 19.1 days (compared with the 5 days a task takes to process; this value was set arbitrarily in this simulation).
- Note the long diagonals of black blocks: This indicates that the facility is working non-stop for long periods.
If this would involve an emergency room, the media would probably publish disaster stories about the terrible queues, and the staff would risk burnout. And yet there is, after all, 10% lee-way in the system!
Conclusion: A facility that cannot control or plan the influx of tasks will experience unreasonable queues as the number of incoming tasks approaches the total capacity. The queues are not a sign that the capacity in principle is too low! There is, after all, 10% of total capacity that is not used. Yet everyone will consider this situation a disaster. This is an important but often overlooked insight.
If we instead look at the goal which the above mentioned KI representative mentioned: A facility that has virtually no queues. How do we achieve it? Let's set the utilization rate at an extremely low value of 20%. This is how it looks:
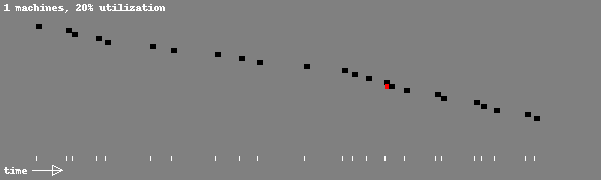 Simulation of task execution and queue. 20% utilization of resources.
Here the situation becomes almost queue-free; very little red is visible. But there is still some! And we also see long stretches where very little happens: The facility idles. Whoever pays for the facility will probably be a little concerned. The luxury of getting rid of the queues is precisely that: a luxury. The facility is five times larger than it in principle needs to be; that is what 20% utilization means.
One would of course be able to go into more depth about these issues, and display graphs that relate the presence of a queue, or the average length of the queue, to the degree of utilization. But I refrain in this post, it is long enough as it is. One can also discuss if we could change the basic assumption I make in the analysis, namely that the assignments are received at random times. Of course, one can in some cases (but not in the emergency ward case) imagine other systems, involving scheduling, which would reduce the misery. But these solutions have their own problems, which it would take too long to discuss here.
I want to conclude with the following call to those who complain of long queues, in health care or in other contexts: Are you prepared to pay for the overcapacity required to achieve the absence of queues? Because even if the activity is paid by others, technically, you should not imagine that it does not cost the overall economy anything. If you have a facility whose capacity is far greater than what it in principle needs to be, it implies idle time, and thus waste: Resources are misallocated. Used to no avail. Could have been used for other things. Consider this before you start whining.